Lighthouse Audit Report
The Lighthouse Audit report gives you an insight into a websites performance, accessibility and SEO, and is available to run from within Chrome DevTools.
Starting an audit
To open a report on any website you visit in Chrome:
- go to the website
- open DevTools (either from menu option More Tools > Developer Tools, or using the shortcut Ctrl+Shift+I on Windows)
- In DevTools open the Audit panel (if not listed click on » then select Audit from the drop down)
- Tip - you can click and drag the panels to reorder them if you want easier access to any of the panels you use frequently
- Click ‘Perform an audit…’ to open the Audits dialogue box where you can select which categories you want (you can leave them all selected)
- Click ‘Run Audit’ and sit back and wait for the report to be generated.
- Tip - run the report in a browser with extensions disabled, as these can inject JavaScript into the pages you view, which will affect the report. Also check you don’t have any JavaScript added by a virus checker, for instance, Kaspersky Internet Security has an option to ‘Inject script into web traffic to interact with web pages’ (under Network settings).
Viewing the audit
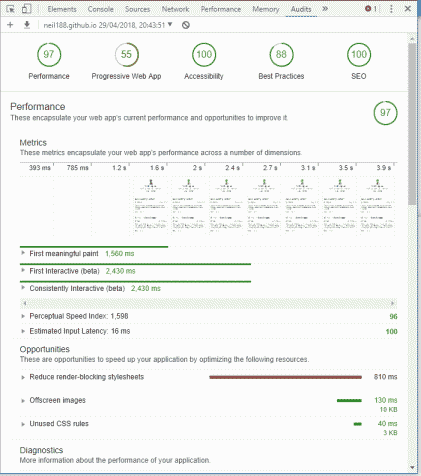
Once complete Lighthouse will show you a formatted report, for example:

The report is divided into the categories you selected and will give you a score for each category, followed by a breakdown of any problems it detects. Each problem will highlight where to find the problem area, plus a learn more link to give you more information and advice on how to improve your rating.
Exporting the report
In order to keep the audit data, you will need to export it, which you can do easily by clicking the download report button at the top of the report.

This will download a json file containing all the report data.
Viewing previous reports
On the DevTools audit panel you can easily view your previously downloaded data - just drag the file over the panel, and when you release it the formatted report will be recreated. You can have multiple reports loaded at the same time, so you can compare how the report has changed over time, the drop-down at the top of the panel with the current site name and report date will list all the current reports and allow you to swap between them.
Lighthouse Report Viewer
An additional way to view your report data is to go to the Lighthouse Report Viewer and load your json file. In addition to viewing the formatted data, this also has options for sharing the data, for instance saving as an HTML page, or sharing to a Github Gist.
More information
For more information on Lighthouse go the Google Developers page