Chrome Dev Tools Debugging
The Chrome DevTools sources tab gives you very powerful tools for debugging your JavaScript.
For more DevTools info see the Google developers guide
The sources panel
Opening DevTools, then selecting ‘sources’ will show you a screen with three panels - the File Navigator, The Code panel, and the Debugging pane.
File Navigator
This shows all the files the current page has requested, useful not only for selecting a file to debug but for seeing all the resources that have been loaded.
Code panel
Shows the code for the currently selected file, and lets you set breakpoints.
Debugging Pane
This will give you lots of useful information when debugging your code. From here you can set and monitor watch expressions, view the current call stack, list the current variables in scope, list (and deactivate) current breakpoints, view DOM breakpoints and set/unset Event Listener breakpoints.
Setting a breakpoint
On the code panel clicking on a line number will set a breakpoint, this line will then be highlighted to indicate the breakpoint. Clicking the line number again will remove the breakpoint.
Additional commands will be shown if you right-click the line number - continue to here lets you move your debugging session on to a line without setting a breakpoint. Select disable to stop a breakpoint from triggering, without removing it (this will be indicated by the colour changing to a lighter shade). Edit breakpoint (or if none already set, this will be set conditional breakpoint instead) allows you to set conditional breakpoints that will only trigger if the condition you set is evaluated to true.
Stepping through code
Once the code hits a breakpoint the debugger will pause execution at that line. The browser will show a paused in debugger message:

This includes the options to Resume script execution, exiting the debugging session, or Step Over Next Function call, which will execute the current line of code without stepping into the code if the line is a function (used for instance if the function isn’t relevant to the current problem).
The Debugging pane also has some extra options available:

These include the Resume script execution and Step over commands, but also has Step into next function call - when the current line is a function this will open the function and pause on the first executable line, and Step out of current function - executes the rest of the function’s code and pauses on the next executable line following the function call.
Debugging panel - scope
In the debugging panel, scope will list all local, closure and global properties, and also allow you to change them. Double-click an entry to edit the current value.
Blackboxing scripts
While debugging you will find the code jumps around a lot to different files, especially when using third-party libraries. Often you won’t be interested in the internals of these files, so you can use blackboxing to ignore them - once a script is blackboxed the debugger won’t step into the script’s source, though it will still be executed. You can blackbox scripts by right clicking then selecting Blackbox script, either in the code panel when the script is open, or from the call stack entry on the debugging pane. In addition, DevTools settings has a Blackboxing pane that allows you to use pattern matching to block multiple scripts.
Event Listener breakpoints
The Debugging pane has a list of Event Listener Breakpoints - this is a list of all available events, setting a breakpoint on any of these will trigger whenever an event listener for this event is triggered (so setting a Mouse > click event will trigger a breakpoint whenever an element.addEventListener(‘click’, handleClick) listener gets triggered by clicking on the element).
DOM Breakpoints - Adding Breakpoint on element attribute change
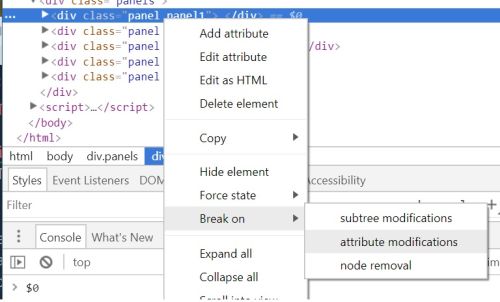
In DevTools Elements panel, right click on an element (or click on the three dots to the left of the element), then select Break on > Attribute change.

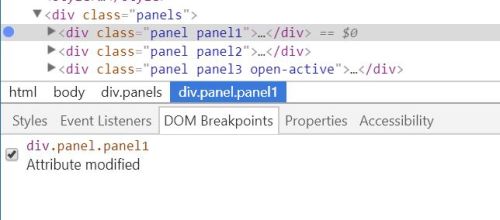
To the left of the element, you should now see a small circle indicating a DOM breakpoint. Additionally, you should now see the breakpoint listed under DOM Breakpoints.

Now, whenever one of the element attributes change then DevTools will pause on the line making the change.
To remove the breakpoint go back to the Elements panel, and repeat the Break On > Attribute Change select (you should see a tick next to this breakpoint). Alternatively, on the DOM Breakpoints panel untick this breakpoint, this leaves it listed, which allows you to easily reset it later.
Using the console to set a debug point
From the console, command debug(function) will invoke the debugger once the function is called. Command undebug(function) to stop the breakpoint.