Chrome Dev Tools Console Tips
The DevTools console in Chrome gives you an incredible amount of tools to help you, spending some time getting to know these tools will definitely make you a better developer.
For more DevTools info see the Google developers guide
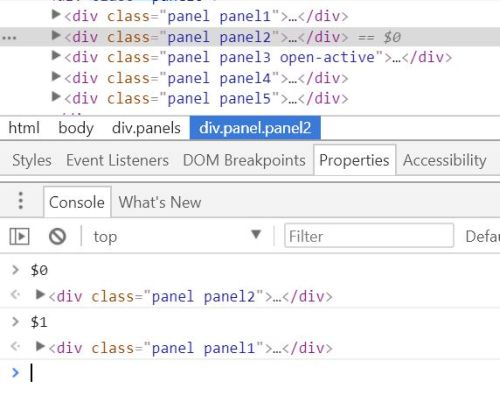
Displaying details of last element/object selected using $0-$4
The last 5 recently inspected DOM elements or JavaScript heap objects are temporarily stored in variables for easy access: $0 - $4.

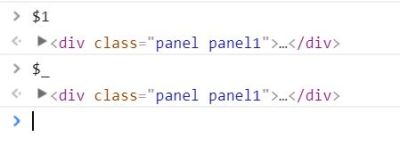
Get last return value using $_
The output of the last evaluated expression is stored in variable $_

Console
As well as the most common console.log('message') you can also used warning messages:
console.warn('Warning') or errors: console.error('Error')
Format specifiers - inserting values
You can use format specifiers such as %s (strings) or %d (integers) to insert values into an output string, for instance
console.log('This is %s number %i', 'test', 1)
to output
This is test number 1.
Format specifiers - styling output
The CSS format specifier %c allows you to format the console output, for instance console.log('%cThis output will be styled', 'color:purple; font-weight:bold')
Testing using assert
console.assert() conditionally displays an error message (second parameter) if the first parameter evaluates to false. For example console.assert('red'==='blue', 'An error!')
Clear console
To clear the console you can click no the second icon above the console, use command Ctrl+L or use command console.clear()
Console dir
The console.dir() command allows you to view an object or element as a JavaScript object and inspect its properties.
Note you can also use the alias dir().
Grouping / Collapsed group
Related output can be grouped together using the group commands. The output can be auto-collapsed using the groupCollapsed command instead. Use console.group(), passing in a parameter naming the group, to start the group and console.groupEnd() once done:
console.group('This is the start of a group')
console.log('hello')
console.groupEnd()
Counting
Use console.count(<identifier>) to display a running count of how many times that identifier has been displayed.
Timing
The console.time(<identifier>) and console.timeEnd(<identifier>) commands give an easy method to time how long a section of code take to run.
Console Table
The console.table() gives you a formatted display of objects and arrays. When called, it will take the properties of an object and create a header. The row data then comes from each index’s properties value.
Storing the output
Right-click and select save as to save the output of the console to a log file.
Trace
The console.trace() command will print the current JavaScript call stack.
Selecting elements from the console
The console provides shortcuts for selecting elements $() for document.querySelector() and $$() for document.querySelectorAll()
Inspecting and element or JavaScript reference
The inspect(<object>) command will take you to either the Elements panel, displaying the selected element or to the Profile panel, displaying the selected JavaScript reference.
Listing event listers for an object
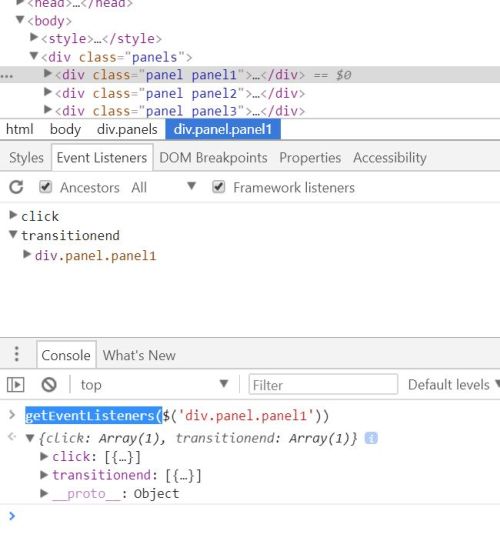
To see event listeners attached to an element, you can either view the Event Listeners section on the Elements panel or use the getEventListeners(<object>) command.

Copy to clipboard
The copy() command will copy a string representation of the specified object to the clipboard, for instance copy($0)
Getting object keys and values
The keys(<object>) and values(<object>) commands will return an array of an object keys or values.
Monitoring functions
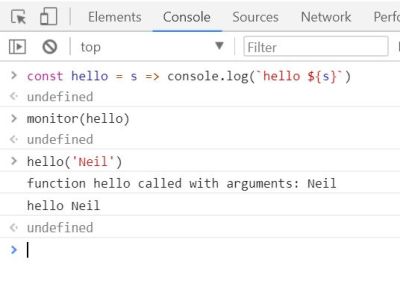
Use the command monitor(<function name> to watch a function, this will print the function name and any arguments that are passed every time it is called.

Use unmonitor(<function name>) to cease monitoring.