Debugging Nodejs
Introduced in Nodejs 6.3+ the debugger inspector protocol allows you to connect to your Node process using various different debugging tools, so no excuses for all those console.log lines!
Debugging using Chrome DevTools
First, start the debugging process by launching your node script with the --inspect script:
node --inspect app.js
or to start the debugging process and break before the first statement is executed use --inspect-brk instead.
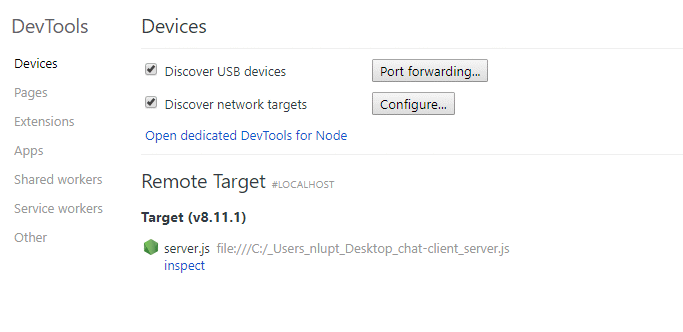
Next launch Chrome and open DevTools. Chrome should automatically detect the running Node.js process and give you the option to open a dedicated DevTools window for that process:

Alternatively, in Chrome go to Chrome://inspect where you should see the process listed, click inspect to start the debugging process.

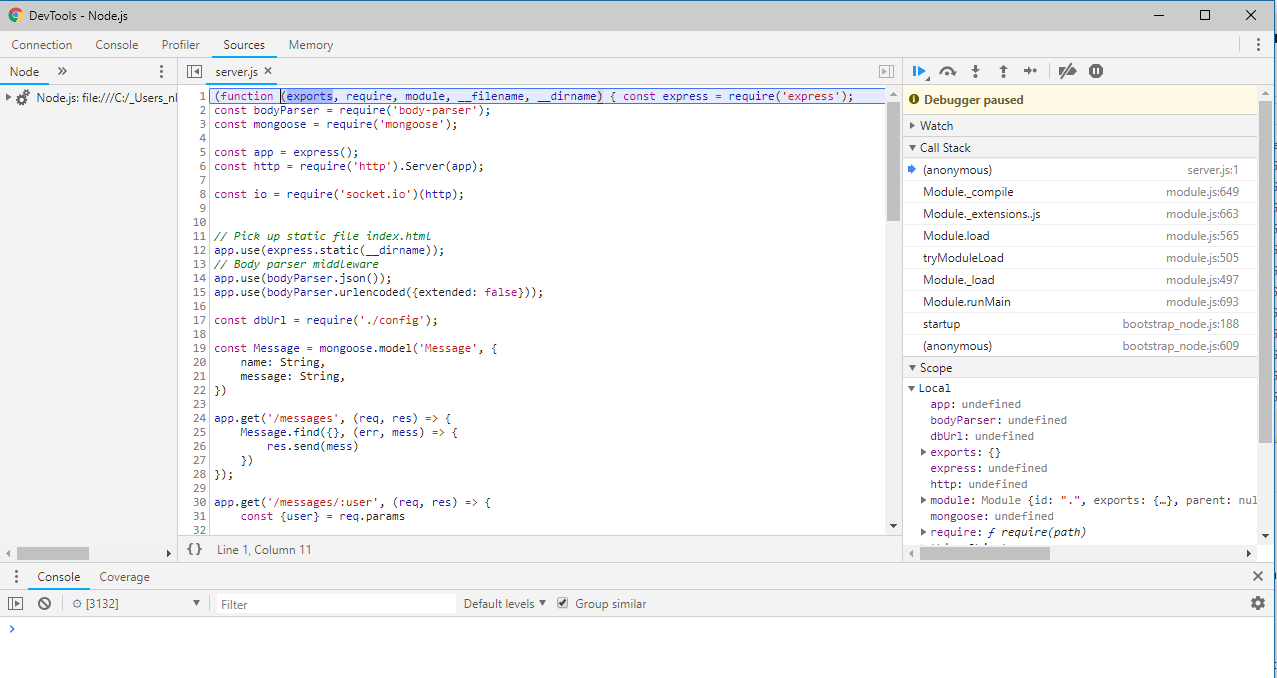
Once you’ve selected your process you will get a DevTools window to debug your process:

Debugging in VS Code
VS Code has a built-in debugger, which comes with support for Nodejs runtime. This will allow you to launch a new debugging process, or attach to an existing debug session. You can get to the Debug view via the Debug action on the Activity Bar, or use the shortcut ctrl+shift+d. The top-level Debug menu also has the most common commands.
The simplest way to get started is to open the file you wish to debug, then use the Start Debugging action F5 which will try starting the debugger for the active file.
You can also set debugging configurations by clicking on the ‘Open launch.json’ button on the Debug view, or selecting the menu option Debug > Open Configurations. This opens a launch.json file in your project folder where you can setup different configs, for instance:
{
    "version": "0.2.0",
    "configurations": [
        {
            "type": "node",
            "request": "launch",
            "name": "Launch Program",
            "program": "${workspaceFolder}\\server.js",
            "stopOnEntry": true
        },
        {
            "type": "node",
            "request": "attach",
            "name": "Attach to running process",
            "port": 9229
        }
    ]
}
which shows one configuration to launch a new process (with a breakpoint immediately on entry), and a second for attaching to an existing process running on port 9229 (for instance a process launched using command node --inspect-brk).
For more info on the VS Code debugging process see the VS Code guides.
node-inspect CLI
The node-inspect utility is a CLI debugger which is bundled with Node and can be launched using:
node inspect server.js
See the Nodejs api documentations for more details on node-inspect.